Introduction
In this detailed analysis, we will delve into the current state of the new home construction market in the United States. We will break down key points and provide additional context where necessary.
National Home Sales
The housing market’s performance in October is a central focus. We’ll explore the factors affecting sales, trends, and the impact of mortgage rates.
Key Points:
1. October Home Sales
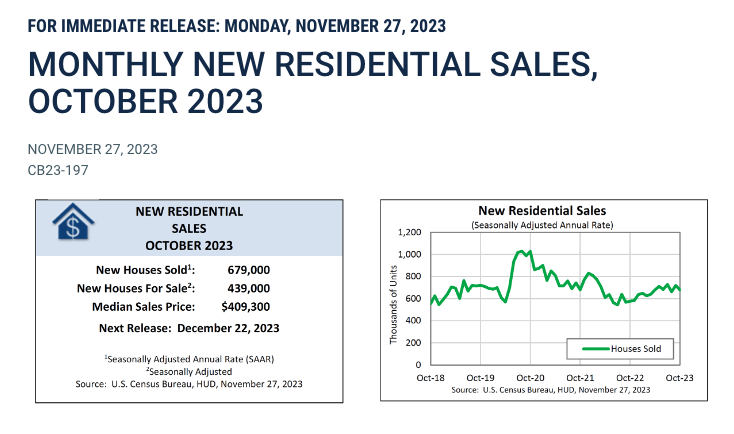
- In October, 679,000 new single-family homes were sold, falling below the forecast of 721,000.
- This represented a 5.6% decrease from September.
2. Impact of Rising Mortgage Rates
- Mortgage rates surged to 7.62%, the highest since November 2000, impacting sales.
3. Comparison to Pre-Pandemic Levels
- Despite the sales decrease, the current pace of 679,000 is on par with pre-pandemic levels, unlike the existing housing market.
4. Builder Incentives and Price Reductions
- Many builders are offering incentives and cutting prices to stimulate sales.
- 32% of builders reported price cuts, the highest rate since December of the previous year.
- 62% of builders provided various sales incentives.
Regional Variations
Regional disparities in sales performance are explored, highlighting significant differences between regions.
Inventory Levels
Inventory levels are crucial indicators of supply and demand balance in the market.
Key Points:
1. October Inventory
- In October, 439,000 new single-family houses were for sale, a 1.4% increase from September but a 5.8% decrease compared to the previous year.
2. Historical Comparison
- Current inventory is notably higher than pre-pandemic levels but lower than the peak in October 2022.
- Inventory remains lower than pre-Great Recession levels.
3. Existing vs. New Home Inventory
- Newly built houses now make up 30% of all single-family houses for sale, significantly higher than the historical average of 12%.
Median Sold Prices
Median sold prices for new single-family houses are examined, emphasizing changes over the past year.
Key Points:
1. Median Sold Price for October
- The median sold price for new single-family houses in October was $493,000, an 18% decrease from the previous year.
2. Price Variations
- Median sold prices for new houses can vary significantly compared to existing houses due to limited new home sales.
Conclusion
This analysis provides a comprehensive overview of the current state of the new home construction market in the United States. It underscores the impact of rising mortgage rates, regional variations, inventory levels, and changes in median sold prices. These insights are essential for understanding the dynamics of the housing market and their implications for stakeholders.